The unit will look at economics growth and the factors that determine it. We will also look at the advantages and disadvantages of that growth as well as the problems of measuring it.
Economic Growth
It is possible to distinguish between real growth and the trend rate of growth. The trend rate of growth of the UK economy since World War 2 has been between 2.25% to 2.5% per year.
Explain what is meant by the term real?
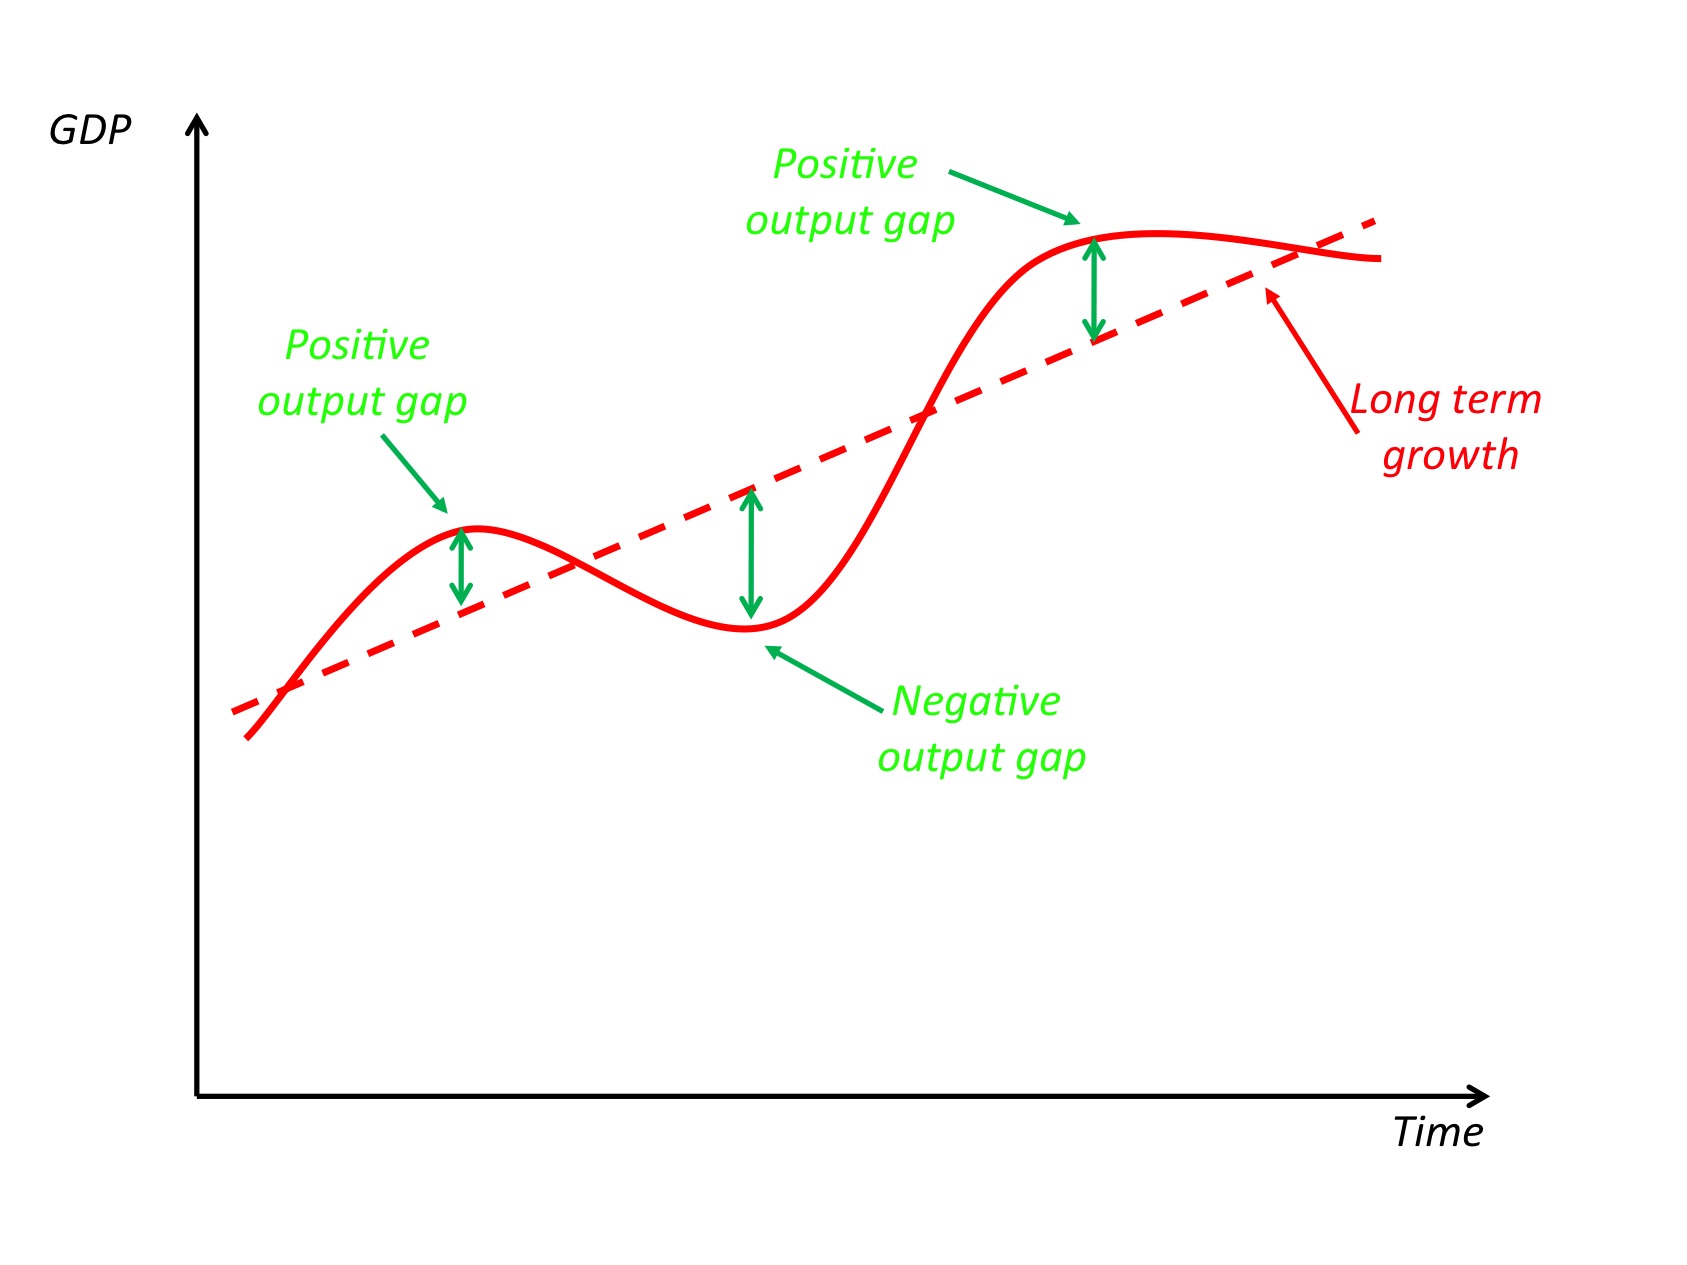
Describe how the trend rate of economic growth can be distinguished from the actual rate of growth by referring to the output gap.
On the diagram below draw a line that shows actual growth rates that are both above and below the trend rate of growth. Highlight the positive and negative output gaps.
There are three main measures used for determining the size of an economy:
- GDP – Gross domestic product
- GNP – Gross national product
- NI or NY – National income
GDP is the figure that is most commonly used. GNP is calculated by adding the net property income from abroad (interest payments, profits and dividends coming into the country minus those leaving it) to GDP. National Income equals GNP minus the depreciation of the economy’s stock of capital equipment (sometimes called capital consumption).
Calculating GDP in the UK
When you hear on the news about “growth in the economy”, the news reader will more than likely be quoting the growth in Gross Domestic Product (GDP) during the last quarter. In the UK there are three different approaches used to estimate GDP:
- GDP from the output or production approach – GDP(O) measures the production of goods and services within the UK economy. This approach will provide the first estimate of the country’s GDP. It is used to measure how much different industries, for example agriculture and manufacturing, contribute to the economy.
- GDP from the income approach – GDP(I) measures the total income from the production of goods and services in the UK. The income figures provided give a breakdown into the income earned by firms, employees and self employed.
- GDP from the expenditure approach – GDP(E) calculates the total expenditure on all goods and services in the UK.
The estimates are gross because the depreciation of the capital assets has not been subtracted.
Explain the difference between gross and net investment.
GDP figures are referred to as estimates because they are updated as more information becomes available. The following explains when GDP estimates for the first quarter of the year become available:
- 1st estimate: The preliminary estimate of GDP growth is based upon Output data is published 3½ weeks after the end of the quarter.
- 2nd estimate: Date for the Income and Expenditure is published eight weeks after the end of the quarter. Statistics for GDP levels as well as growth are given at this stage.
- 3rd estimate: The full set of UK National Accounts is published 12 weeks after the end of the quarter.
Many organisations will produce estimates for GDP growth well in advance of their publication date. The fan chart below shows the probability of various outcomes for GDP growth based upon estimates made by the Bank of England’s Monetary Policy Committee. The GDP data to the left of the first vertical dashed line is drawn as a fan; this is due to the fact that GDP data is revised. To the right of the line, the fan reflects the uncertainty over GDP growth in the future. The MPC believes that there is a 10% chance of GDP growth lying within the darkest central band. Then there is a 10% chance that it also lie within each pair of the lighter green bands. This means there MPC have 90% confidence that GDP growth with lie within the fan. The bands become wider in the future due to increasing uncertainty.

The chart below shows previous GDP growth in the UK

What is the definition of a recession?
Is the UK presently in a recession?
1q growth is a comparison of output in the most recent quarter with the previous quarter; this is known as quarterly growth. 4q or annual growth is a comparison of output in the latest calendar year with the previous year. All GDP figures are real as they have been adjusted to remove the effects of price change – they are sometimes described as chained volumes. The data is also seasonally adjusted.
This table highlights the impact of previous recessions. The final column indicates the number of quarters from the start of the recession until output reached its pre-recession level again.

Using the Bank of England’s GDP fan chart, how do you think the recent recession will compare to previous recessions?
Global Economic Growth
There is a great variation in the rate of growth of the world’s economies; Macau’s is growing at 27.3% in 2007 whilst Fiji’s shrank by 6.6%. The table below shows the Real GDP % growth for 2007 for the G-20 major economies.

The level of GDP in all nations can be highlighted on the diagram below.

Many predict that we will move into a global recession in 2009. The chart below is based upon 83 Consensus country forecasts.

Factors That Lead to Growth
Economic growth can be demonstrated by an outward shift in aggregate demand.
Demonstrate the impact of a shift to the right of AD on the diagram below.

It is also possible to achieve economic growth through the use supply side policies.
Demonstrate the impact of a shift to the right of AS on the diagram below.

Outline the benefits of achieving growth via the supply side as opposed to demand management.
Identify whether each of the following is a demand or supply side factor. Briefly explain how each of these will lead to growth.
- Research and development leading to technological progress
- Improving the quality of labour through training and education
- Improving the quantity of labour by increasing labour market participation rates
- Increasing investment in capital
- Improvements in natural resources
- Increased flexibility of markets
- Improved mobility of resources
- Improving the system of incentives
- Expansionary fiscal policy
- An improving and stable national and international economic climate
- Encouraging free trade
- Increased government initiatives to encourage entrepreneurship
- Improvements in productivity
Factors Affecting the Economic Cycle
There are a number of factors that can contribute to the economic cycle.
Demand-side and Supply-side shocks
Demand and supply shocks will have an impact upon the AD and AS curves respectively. The shocks could potentially shift the curves in either direction, however they frequently will shift the curves to the left and lead to a fall in national income.
By their very nature economic shocks are unpredictable and their impact will not be what normal models of AD and AS would predict. Whether the shock will require a policy response from the government will depend upon if the shock is expected to have a longer term impact upon the economy.
External demand-side shocks take place outside of an economy, for example, events that take place in the USA or Europe will have an impact on the UK’s economy.
Provide some examples of external demand shocks that have affected the UK in recent years.
Internal demand-side shocks take place within an economy, for example, a drop in house prices or a dramatic change in the stock market.
Analyse the impact on the UK economy of the recent fall in house prices that has occurred due to the credit crunch.
The impact of the demand shock will depend upon the elasticity of the aggregate supply curve.
Use the diagrams below to demonstrate how the elasticity of the AS curve will affect the impact of a demand shock on the equilibrium levels of national income and the price level.

Explain the shifts in equilibrium.
Supply-side shocks relate to any events that affect the quantity or quality of the factors of production, such as the price of oil or other commodities. Not all economies will be affected by a supply shock to the same degree.
Analyse how a dramatic increase in the price of oil will impact different economies around the globe.
Political cycles
As a general election approaches governments will often attempt to improve their approval ratings by encouraging economic growth. After the election the government is forced to slow the economy down to prevent demand pull inflation.
How has making the Bank of Independent affected the impact of the political cycle on the economic cycle?
Speculative bubbles
Speculative bubbles occur when goods, houses or shares are traded in high quantities for values that are far greater than their worth. As it is difficult to know the true worth of a good during the increase in price, bubbles can only be identified after there has been a crash in prices and they return to their true worth. This decrease in price is also known as a bubble bursting.
The dot-com bubble is a recent example of how prices soared out of control, only to fall just as dramatically when the bubble burst. The value of the NASDAQ (an American stock exchange that specialises in technology companies) peaked at 5,132 on Friday 10th March 2000, more than double its value just a year earlier.
It is possible to place sell orders before the stock market opens. On Monday 13th March a number of multi-billion dollar sell orders for major IT stocks (Cisco, IBM, Dell and others) were placed. This led to the NASDAQ opening that Monday four percent down on the previous Friday’s high.
This triggered a chain reaction of selling and the NASDAQ lost nearly nine percent in value by the end of the week, falling from roughly 5,050 on 10th March to 4,580 on 15th March. By the end of March 2001 the value of the NASDAQ had fallen to 1,840. The highest value the NASDAQ has reached since was 2,810 in November 2007.
Another bubble to have burst recently has been the UK’s housing market in 2008. The concept of a bubble is not new; other examples are the South Sea Company in 1720 and the Tulip Mania that took place in Holland in 1637
The multiplier and accelerator models
Keynesian economists point to the effect of the accelerator and multiplier on the economy.
Describe what will happen to investment, according to the accelerator theory, in response to an increase in consumption.
What impact would the multiplier have on the increases in consumption and investment?
This process will lead to national income rising at a faster rate. The opposite will occur when there is a downturn in consumption.
Supply-Side factors and Trend Growth
Any improvements in the quantity or quality of the factors of production will lead to trend growth.

Explain the shifts in the above diagram.
The most common factors that are highlighted that will lead to a shift in the long run aggregate supply curve are investment, technology, education and training. This is likely to bring about sustainable growth as opposed to short term increases. This fits in with the government’s secondary objective of “sustainable growth”.
Show how improvements in the trend growth would shift the PPF on the diagram below.

Costs and Benefits of Economic Growth
There are a number of costs and benefits of economic growth that are highlighted by economists.
Briefly explain each of the following costs and benefits. Rank them in order of what you consider to be importance.
Benefits
Impact upon:
- National income
- Employment and unemployment
- Tax receipts
- Provision of merit goods such as education, health care and social housing
- The PPF and LRAS
- The correction of externalities
- Living standards; both qualitative and quantitative factors
- On the quality of public services
- Quality of infrastructure
- Levels of poverty
Costs
Impact upon:
- The price level
- Environmental degradation
- Depletion of non-renewable resources
- The production of consumer goods and services in the short run
- Externalities
- Equality of income and wealth
- Balance of payments
- The sustainability of the growth if based upon finite resources
- Population growth
Problems of Using National Income Statistics
There are a number of problems of using GDP data to measure living standards and compare them between countries. The main criticisms are:
- The size of the underground economy or black market isn’t included in official GDP estimates. This means that transactions such as illegal drugs, prostitution, weapons, illegally imported tobacco and fake DVDs are missed out. Many people might offer to work for cash in hand, particularly where labour is exchanged rather than good, for example, gardening, decorating, car mechanics. Goods in the underground economy will often be cheaper than those in legal market; this is because the supplier does not have to pay taxes or for production costs in the case of stolen goods.
Identify other examples that would be included in the underground economy.
- Non-market transactions are excluded from GDP figure, for example, activities such as household chores and volunteer or unpaid services. This will mean that GDP is understated. If you paint or clean your own house it will not be included in GDP, however if you were to employ a painter or cleaner it would be.
Can you think of any other examples of activities that may or may not be included in GDP?
- Increased use of health care may increase GDP if many people are sick and receive expensive treatments; however this is not a desirable situation.
- Increasing crime might lead to increased GDP as more police are employed and overtime is paid; again this is not a situation we would hope for.
- GDP includes work that leads to no net improvement because it is simply repairing damage, for example, rebuilding after a natural disaster or cleaning up the litter in a town centre after a Saturday night.
Are there any other examples where GDP will be increased, but it doesn’t lead to a net improvement.
- GDP does not take disparity in incomes between the rich and poor into account.
Does it matter than GDP doesn’t account for differences in average incomes?
- GDP ignores externalities such as damage to the environment.
Are there any countries whose growth is leading to proportionately more externalities? Explain your answer.
It makes no account for quality improvements and the innovation of new products; this means that GDP understates true economic growth. A computer made today is significantly more powerful that one made 15 years ago, but due to the fact that it costs less today it will add less value to GDP
Provide some other examples of goods that are “worth” more today, but count less towards GDP.
- The GDP figure does not measure the sustainability of the growth. A country may achieve a temporarily high GDP by over-exploiting natural resources, for example, the large deposits of phosphates gave the people of Nauru one of the highest per capita incomes on earth, but since 1989 their standard of living has declined sharply as the supply has run out.
- Does the increase in GDP reflect a real wealth expansion or is it simply a reflection of capital consumption? The Austrian economist Frank Shostak asked “…if a government embarks on the building of a pyramid, which adds absolutely nothing to the well-being of individuals, the GDP framework will regard this as economic growth. In reality, however, the building of the pyramid will divert real funding from wealth-generating activities, thereby stifling the production of wealth…”
Alternative Methods of Comparing Living Standards
There have been many other measures of economic growth and living standards put forwards as a result of these problems of using GDP data.
Human Development Index (HDI)
Was developed in 1990 and is used to rank whether a country is developed, developing or underdeveloped. It combines the measures of life expectancy, literacy, educational attainment and GDP per capita. It is approved by the United Nations Development Program and is probably the most used measure of human development.
It has been criticised due to the fact the index is simply a sum of it constituent measures. Its value for a particular nation can vary greatly from year to year as the data changes. The HDI index is a number that is hard to interpret, therefore many people just look at the rankings.

A level of 0.5 is considered to represent low development and all 22 countries that are in that category are located in Africa, however, 9 of these countries are on the verge of joining the medium development sector.
0.8 is classed as highly developed and historically, Iceland, Norway and Canada are the most developed countries in the world although Iceland may suffer a decline in its HDI after the impact of the financial crisis is factored into the calculations. The chart below shows how the HDI figures have changed over the past 30 years.

The happy planet index (HPI)
This combines human well being with environmental impact to measure the efficiency by which people live their lives. The index doesn’t reveal the ‘happiest’ country in the world but shows the relative efficiency with which nations convert the planet’s natural resources for the well being of their citizens.
The HPI reflects the average years of happy life produced by a given society, nation or group of nations, per unit of planetary resources consumed. It incorporates three separate indicators: ecological footprint, life-satisfaction and life expectancy.
The New Economics Foundation (NEF), who introduced the index in July 2006, set a target for nations to aspire to of 83.5 on a scale of 0 to 100. At this point in time, the highest HPI is only 68.2, scored by the Pacific archipelago of Vanuatu. The lowest is Zimbabwe’s at 16.6.
No country achieves an overall high score and no country does well on all three indicators; Vanuatu, for example, has only a moderate level of life expectancy at 69 years. In the United States and Germany people’s sense of life satisfaction is almost identical and life expectancy is broadly similar. Yet Germany’s Ecological footprint is only about half that of the USA. This means that Germany is around twice as efficient as the USA at generating happy long lives based on the resources that they consume

It has been criticised due to the fact that it completely ignores issues like political freedom, human rights and labour rights
Genuine Progress Indicator (GPI)
The GPI is a concept of green economics and welfare economics that attempts to measure whether a country’s growth, increased production of goods and expanding services has actually resulted in the improvement of the well-being of the people in the country. It is claimed that it can measure economic progress in a more reliable way, as it distinguishes between worthwhile growth and uneconomic growth.
The GPI also takes into account both the costs and benefits of production, as opposed to just the benefits that contribute to GDP.
Outline the problems that expanding production can lead to.
GPI data for European countries and the United States show a steady decline over the last 30 years.
![[Google]]( http://revisionguru.co.uk/revisionguru/wp-content/plugins/easy-adsense-lite/google-light.gif)